Energy Reduction Solution Promotion for Demo Application
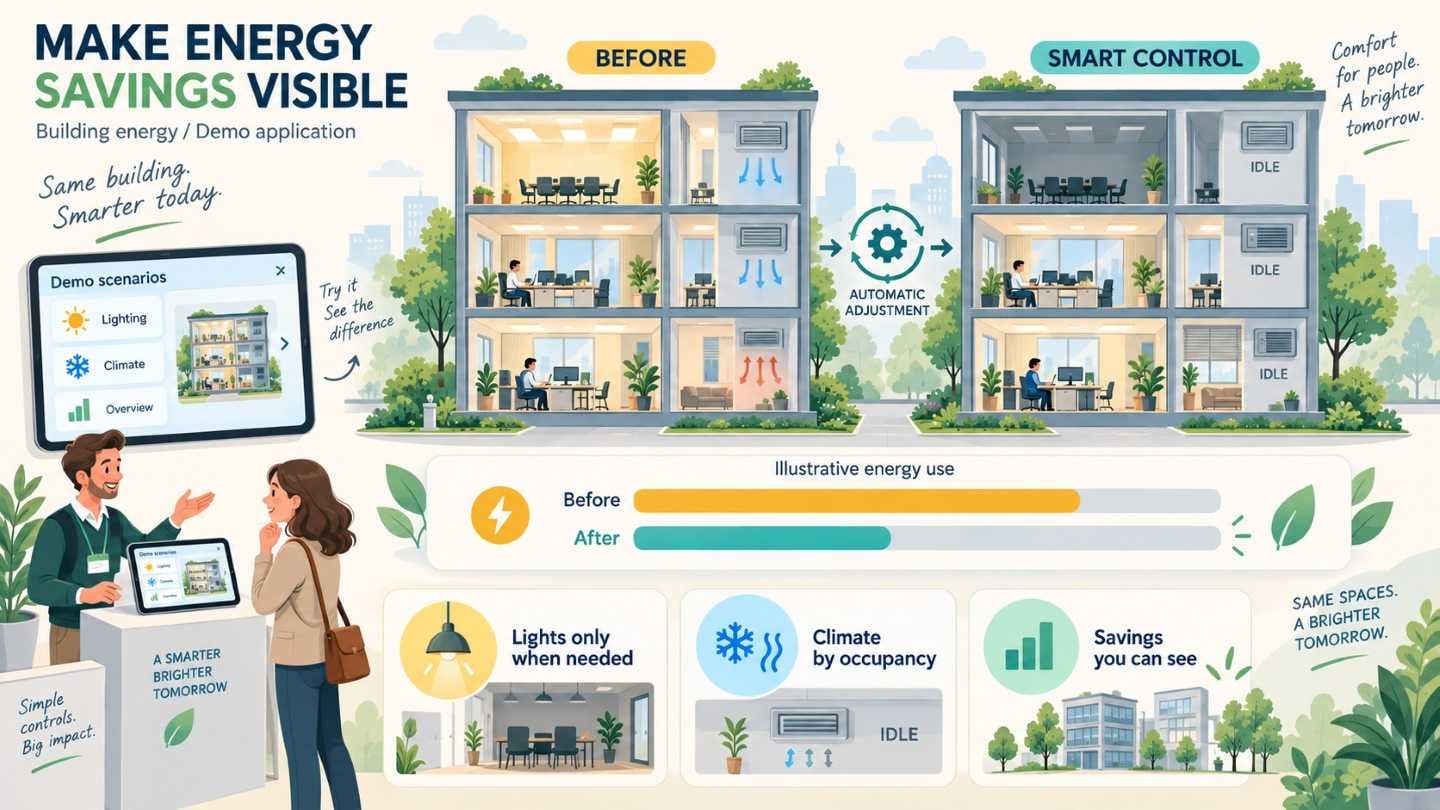
A few minutes at a stand, in front of someone who may not be technical.
The energy solution had to show what it saves, quickly, at sales meetings and exhibitions.
A demonstration is an argument about which scene to show. Pick the function that saves the most and it may take too long to read; pick the one that reads instantly and it may not be the point.
We chose the moments where the saving is visible on its own and built the demo application around them.
Technology trends
Written by AEON from public sources. It describes the field, not the project above.
Since the mid-2010s, the way energy savings are presented has shifted from projection towards proof. A saving used to be something a vendor demonstrated and a buyer took largely on trust. Today the same figure is more likely to be audited, reported to a regulator, written into a performance contract or checked by a tenant with access to the meter data. The audience for an energy number has widened, and so has the scrutiny.
Part of the difficulty is that a saving is not a quantity anyone can read off an instrument. The Efficiency Valuation Organization, which maintains the main international protocol for measurement and verification, points out that savings cannot be measured directly, because they are the absence of consumption, and must be found by comparing measured use before and after with adjustments for changed conditions. Weather, occupancy and operating hours all move the baseline. Credible reporting has therefore come to mean normalised figures and stated assumptions rather than a single before-and-after bar.
Research on feedback has also tempered expectations about what a display alone can achieve. A meta-analysis of 42 studies in Psychological Bulletin found that energy feedback works overall but with a small and widely varying effect, depending on frequency, medium, comparison and duration. Showing people their consumption helps most when it is timely, set against a meaningful reference and connected to something they can actually change.
Policy has made verified performance a requirement in more places. New York's Local Law 97 applies emissions limits to most buildings over 25,000 square feet; the first reports, covering 2024, were due at the end of 2025, and the city says 93 per cent of covered properties filed. In Europe, the Smart Readiness Indicator rates a building on how well it optimises energy use, adapts to occupants and responds to signals from the grid. It remains voluntary for now, but it frames savings as a capability of the building rather than a one-off result. Flexibility, meaning when a building uses energy as well as how much, is becoming part of the story alongside efficiency.
For the people who read these figures, including facility managers, finance teams, tenants and auditors, the interface carries more responsibility than it used to. A saving shown without its baseline invites doubt; a saving shown with too many caveats loses its audience. The emerging practice is to pair a clear headline with an inspectable path behind it, so the same view can persuade a newcomer and satisfy a sceptic, and to link each figure to the actions that produced it.