New Dreams Data Visualisation Consulting and Build
Executives do not read data. They look at it for as long as it takes to decide something, and then they stop.
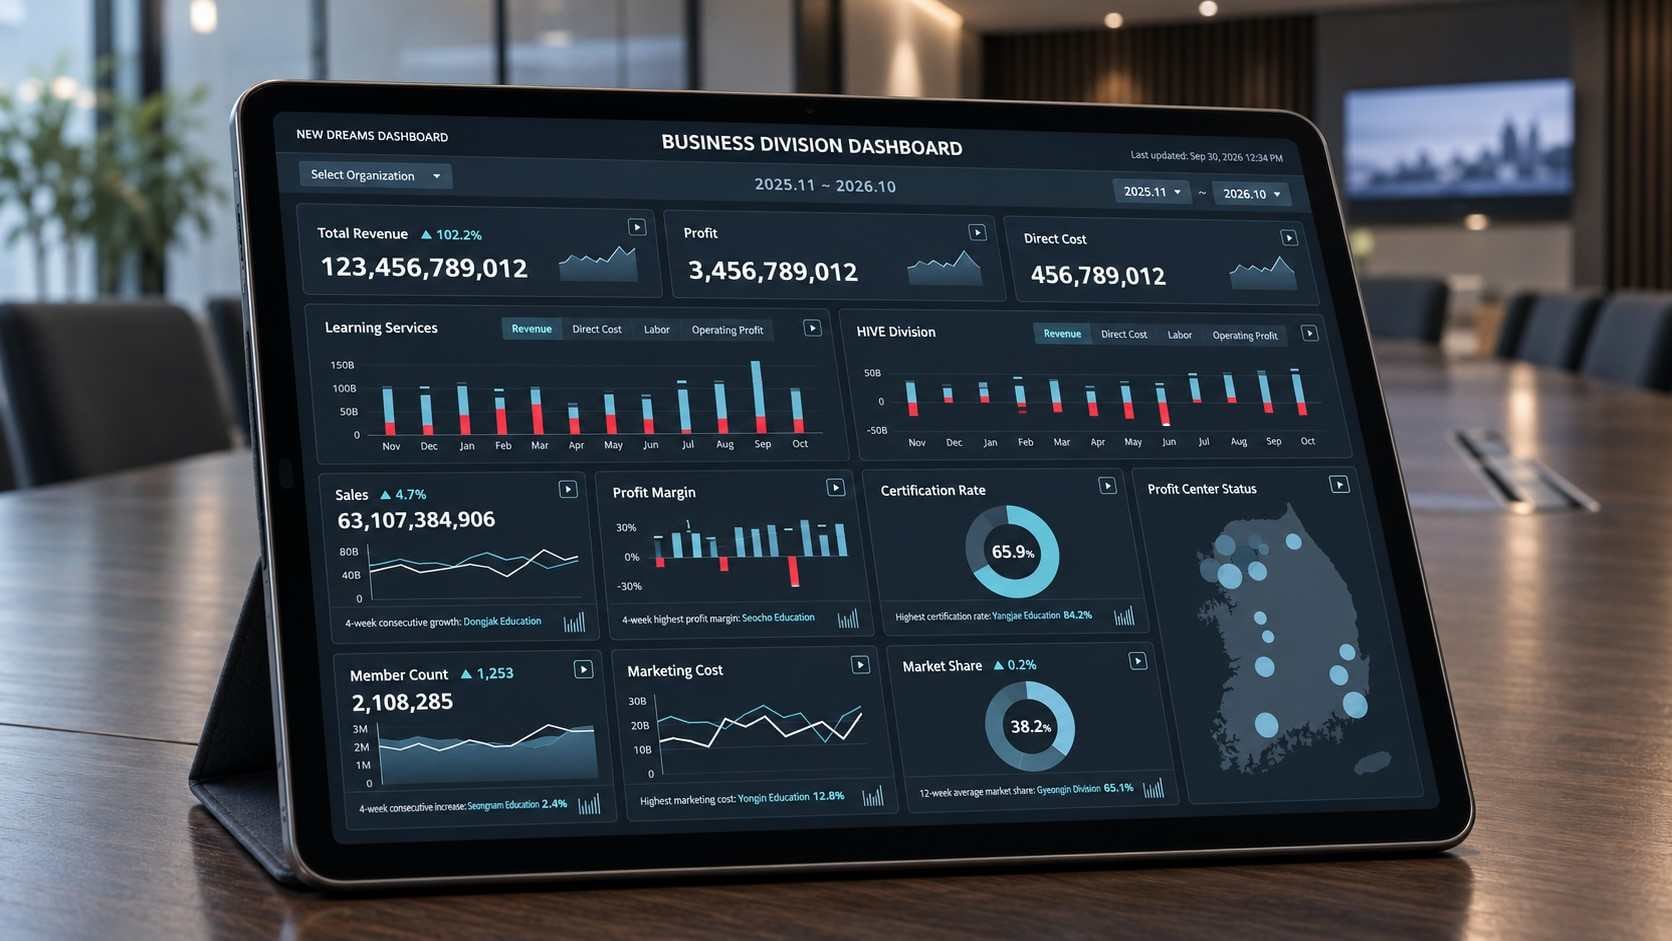
A management report for a chief executive, on a tablet. Reporting had been split between paper and screens and multiplied into a different format for every department.
What a chief executive needs to see is not a smaller version of what a centre manager needs to see. So the work was to decide, level by level, which indicators appear at all — and how plain a chart has to be to survive a glance.
We interviewed eight people across three levels before drawing anything, then set the indicators for each level, brought the reporting formats into one, and laid out the daily, weekly, monthly and annual views on the principles that came out of it.